Abstract
Introduction:
Patient-derived xenografts represent one of the best models for simulation of acute myeloid leukemia (AML). The clonality of this neoplasm has been recently very well described, using next-generation sequencing. However, the proliferative advantage of specific recurrent mutations and sub/clones in the xenotransplantation setup still remains to be addressed on a larger scale.
Aims:
1) To compare the clonality of AML in primary samples and corresponding xenografts, as defined by the presence of dominant and/or minor subclones. 2) To compare the frequency of mutations in individual genes between the primary and the xenograft samples, and assess their hierarchical and proliferative role.
Methods:
AML bone marrow (BM) leukocytes were injected via tail vein into NOD scid gamma (NSG) mice, 1-2×10⁶ cells per mouse, 1-4 mice per AML sample. Human leukocytes (huCD45+) were isolated from murine BM on FACSAria Fusion (BD Biosciences). Targeted amplicon sequencing was performed using ClearSeq AML Haloplex (Agilent) on MiSeq and NextSeq instruments (Illumina). The panel covered 47 exons in 19 genes; CEBPA gene was excluded for inadequate coverage. To achieve high sensitivity and specificity of variant detection, 3 variant callers (Pindel, VarDict, VarScan) were used. Mutation detection threshold was set to 2% variant allele frequency (VAF). The VAF of all FLT3-ITD s was determined by fragmentation analysis. Relative VAF (relVAF) expressed the proportion of an individual mutation/clone in the whole leukemic population.
Results:
We analyzed the mutations detected in 22 primary samples obtained from AML patients and the corresponding xenografts (18 patients in total: 11 de novo samples, 3 relapse samples, 4 pairs of de novo + relapse samples). When assessing the clonal composition (aim 1), we were able to identify dominant/founding clones present both in the primary sample and the corresponding xenograft in 18/22 samples. These clones carried mutations with median relVAF 95% (range: 67-100%). In 9/18 samples with dominant/founding clones, minor subclones were also detected. In 4/22 samples, no mutation representing a dominant/founding clone was identified.
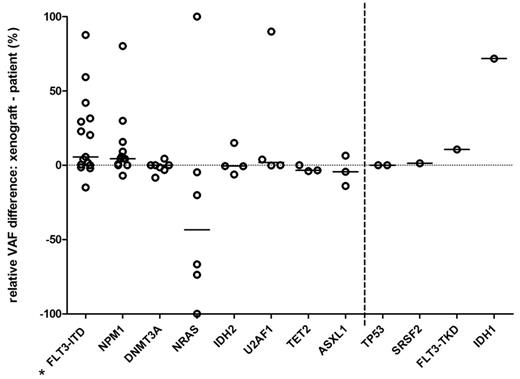
Next, we compared the frequencies for individual mutations, between the primary samples and corresponding xenografts (aim 2). Mutations in the genes DNMT3A (7/22), IDH2 (4/22), TET2 (3/22), and ASXL1 (3/22) showed high conservation, with relVAF difference ≤ 15%, between the matched primary and xenograft samples (see Fig. 1). NPM1 mutations from primary samples were retained in all xenografts, however with > 15% relVAF increase in 3/13 samples. Mutations in U2AF1 showed < 5% relVAF differences in 3/4 samples, but a complete gain after xenotransplantation in 1 sample. NRAS mutations were gained in 1/5 and lost in 3/5 samples, post-transplant. FLT3-ITD was lost in 3/10 and gained in 5/10 samples. Multiple FLT3-ITD s were often present in both primary and xenograft samples. Moreover, FLT3-ITD showed a statistically significant trend towards an outgrowth in xenografts, where a minor clone from the primary sample often developed into a dominant clone in mice. Mutations in genes TP53 , SRSF2 , IDH1 , and FLT3-TKD were detected only in ≤ 2 matched primary and xenograft samples, which limited the general assessment of their clonal roles.
Conclusions:
The engraftment of dominant/founding AML clones in 18/22 xenotransplanted samples demonstrates the general capability of the NSG mouse model to simulate AML clonality. The mutations representing the founding clones showed highly stable relative VAF between the primary and xenograft samples, which indicates their early acquisition and/or crucial role in the clonal development. FLT-ITD subclones showed preferential outgrowth in xenografts, caused by a proliferative advantage and/or low dependence on specific microenvironment. The frequent disappearance of NRAS mutations in xenografts underlines the uncertain proliferative and clinical importance of this mutation.
Supported by Ministry of Health of the Czech Republic, grant nr. 15-25809A. All rights reserved. Supported by project MUNI/A/1106/2016.
Figure 1. Difference in relative VAF between mutations in primary samples and the corresponding xenografts. Each circle represents individual mutation in the specific gene. Lines represent median values. Asterisk: p < 0.05, t-test.
Mayer: Novartis: Research Funding; Eisai: Research Funding.
Author notes
Asterisk with author names denotes non-ASH members.


This feature is available to Subscribers Only
Sign In or Create an Account Close Modal